
How To Unpivot Multi-Select Survey Data
If you’re analyzing survey data in Excel, you may find that running analysis for questions that allow multiple selections, commonly referred to as multi-select or choose-many questions, can be a little tricky to analyze.
This isn’t really an issue if you’re using commercial stats software like SPSS or JMP. But if you’re trying to analyze this type of data in tools like Excel or Google Sheets, you’re going to run into some challenges.
When it comes to single-select or rating questions (where the respondent can only choose one option), analyzing the data is relatively straightforward because only one option can be selected. And when all the data for a question is contained within a single column, you can easily pivot the data, as shown below.
But for multi-select question, the data structure is quite different. The survey respondents can select one or multiple options from a list, and what you typically see with raw data exports from tools like SurveyMonkey, Qualtrics or QuestionPro is a format like the image below. With this structure, the response options are spread across columns, with a cell value of 1 indicating that the option was selected, and cell value of 0 indicating that the option was not selected. But it’s worth noting that sometimes other values can be used instead of 1 and 0’s, such as Yes/No, or Selected/Not Selected.
For example, let’s say you had a multi-select question in a survey that looked like this:
Which of the following attributes, if any, would you use to describe << brand name >>? Choose all that apply.
Fashionable
Affordable
Durable
High quality
Premium
Modern
Innovative
Appealing
None of the above
With this question, the raw data export would usually look something like this:

This kind of data structure creates real problems when it comes to data analysis, because you can’t easily pivot the full list of response options for a question. Instead, you can only pivot one response option at a time, which can be very time-intensive. There is a solution to this problem, which funnily enough is referred to as ‘unpivoting’ your data.
There are a few ways you can go about unpivoting a dataset, such as using Power Query in Excel. Jon Acampora over at Excel Campus has a great post on how to do this, which you can read here.
However, PowerQuery isn’t available for all versions of Excel on Mac, so I published an article about how to use a Google Sheets plugin, known as Power Tools, to accomplish the same output as PowerQuery.
Unfortunately, Power Tools isn’t free, and although it does offer a trial option, it won’t be a long-term solution for those who can’t afford to pay for it.
So I wanted to create another way for the students enrolled in my online courses, and of course, YOU (my readers), to quickly restructure multi-select data in Excel. And I’m happy to share that I’ve written a simple Python script you can use to accomplish this. The script is available at the end of this article, embedded via Streamlit, so you don’t need to run any code. Just upload your file CSV and you’re good to go!
But before we get to the script/web app, there are some steps you need to follow.
How to use the tool
You’ll need to follow a few steps to prepare your data before uploading it to the web app. But first, please note that you can only run this script for one multi-select question at a time.
Step 1 - Clean the data
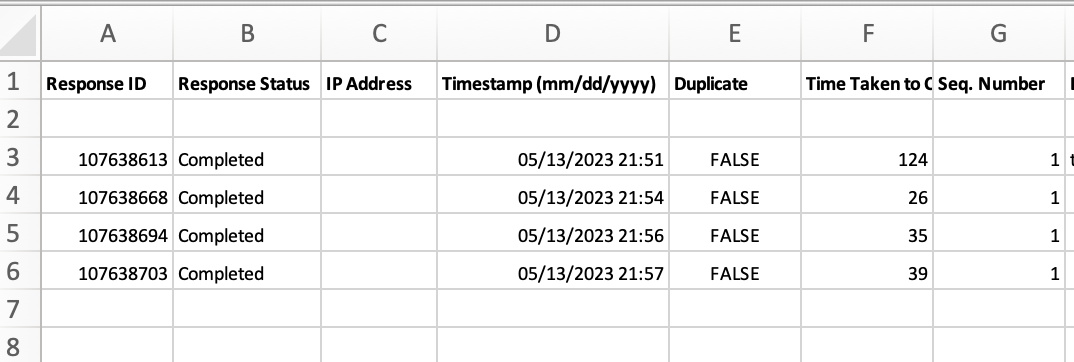
In order to prepare your data, you will need to remove all columns except for those that correspond to the multi-select question you wish to unpivot, as well as the column that corresponds to the unique response identifier in your dataset. Every survey tool will export a unique respondent identifier, and it will usually be the first column in the data file. The image below shows an example of QuestionPro’s data export, and as you can see, the first column (Response ID) is the unique identifier we’re looking for.
Once you’ve trimmed your data down to a) the unique response identifier column and b) the columns for the multi-select question you wish to unpivot, your file should look like the image below.
Not all survey software exports present multi-select question values in the same way. Some will use a value of 1 or 0, where 1 = selected and 0 = not selected, while others use different schemas. QuestionPro, as one example, uses a value of 1 for selected, then a blank cell to indicate if the option was not selected.
As such, my script will accept a range of cell values to indicate if the response option was selected or not selected. The values below will all be recognized by my script.
Selected can be shown as any of the following:
1
Yes
Selected
True
Not Selected can be shown as any of the following:
0
No
Not selected
False
< blank/empty cell>
You can download a sample data file that shows the different types of cell values that are accepted.
The above cell values should be plug-and-play for data exports from most tools (e.g. SurveyMonkey, QuestionPro, Qualtrics). But note that if you’re multi-select cell values are different from what’s listed above, the script won’t work.
Step 2 - Relabel response id column header (A1)
In order for the script to work, you need to ensure your response id column header (cell A!) is labelled exactly as follows:
response_id
Step 3 - Save your file as a CSV
Now that you’ve finished preparing your data file, save it as a .CSV.
Step 4 - Upload your file to the web app
You’re now ready to upload the file to my web app. You can either use the embedded app below, or you can find the app hosted on Streamlit via the following link:
If you’d like to run the script locally on your machine, you can download the python script from Github here.
