
How to Action Your Analytics Benchmarks Using The 20% Rule

Header image @austindistel via Unsplash
I get a lot of questions about how to source or create meaningful benchmarks for your marketing data. Whether it’s for web or app analytics, email marketing and social media marketing, having relevant and timely benchmarks is essential to giving your data context and meaning.
In the past, I’ve written about three types of benchmarks you should be thinking about, which include historical benchmarks (i.e using your data), competitor benchmarks (i.e. using 3rd party sources) and industry/category benchmarks. If you’re interested in learning more about these three types of benchmarks and how to prioritize them, I recommend giving my prior article a read.
Obtaining meaningful benchmarks is one thing, but knowing when and how to action this data is another. To help with this, I want to introduce a framework I call the 20% rule for actioning analytics benchmarks.
Before I get into how it works, let’s talk about why this is needed.
In the world of marketing and communications, there can often be immense pressure to never fail. This kind of pressure usually comes from the top, whether it’s a marketing director, CMO or CEO, and it’s reinforced by organizational culture. As a result, senior management can sometimes hold unrealistic expectations about campaign performance, expecting to see every subsequent campaign perform better than the last.
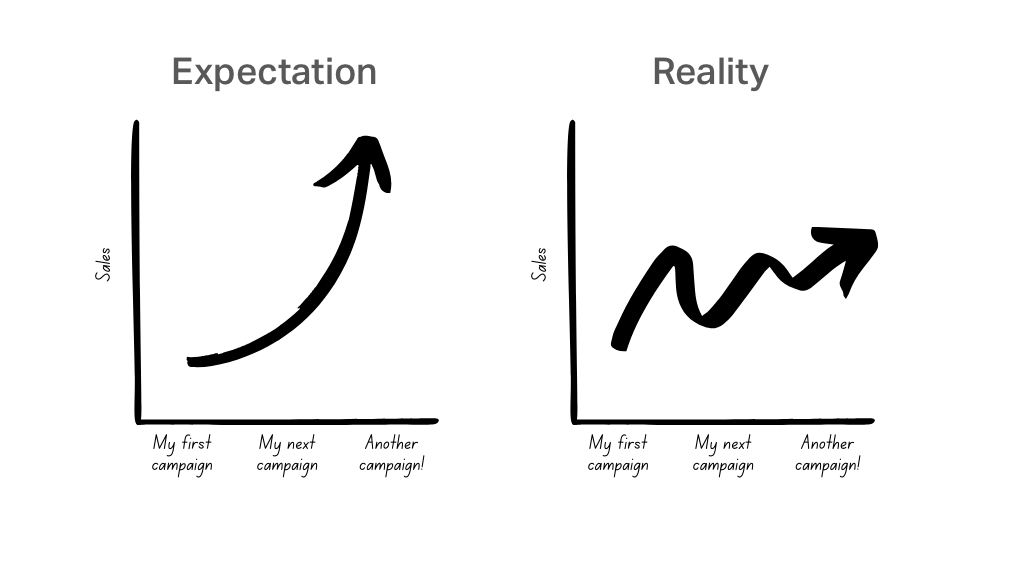
But in reality, success is never constant. We win some, and we lose some.
But there’s usually more to learn in failure than there is in success. The trick is to ensure you’re taking the time to actually learn from failure and then apply that wisdom to optimize future campaigns. This is why I always advocate for creating an organizational culture, especially within marketing, that is accepting of and embraces failure.
And this is where the 20% rule comes in. It gives you and you’re senior management clear guidelines for when to take action based on your campaign outcomes in relation to your historical benchmarks. Or more specifically, it lets you know how far from your benchmark you can deviate before you decide to take action.
How does it work?
Say your historical benchmark for banner ad clickthrough rates (CTR) is 1.5%, based on your last 5 campaigns. But then you find that CTR dropped to 1.3% for your latest campaign. Based on this drop in performance, what should you do? Should you invest time and resources into uncovering what went wrong? The answer comes down to the threshold you set for allowing your performance to deviate from your historical benchmark. And the 20% rule gives you a starting point to think about that threshold.
To apply the 20% rule, you will calculate an upper and lower bound for your benchmark. The upper bound is set at 20% above your benchmark, while the lower bound is set at 20% below the benchmark. If your current campaign performance falls within the upper and lower bound then the deviation from your benchmark is acceptable and you don’t need to take action.
If your performance outperforms your benchmark by 20%, then you’ve done something extraordinary, and you should investigate to see what learnings you can glean from the success, and then apply this knowledge to future campaigns.
On the other hand, if your performance underperforms by more than 20%, you’ve missed the mark and need to investigate what went wrong, and apply what you’ve learned to future campaigns.
It's time for some math!
So how do you calculate the upper and lower bounds? We’ll do this by simply calculating the percentage change, and this can apply equally well if you’re working with whole numbers, percentages, currencies, etc. Here’s what the equation looks like for calculating the percentage change.

If we apply this to the example from earlier, the decrease in performance (from 1.5% to 1.3%) only represents a 13% deviation from your benchmark (i.e. [1.3-1.5/1.5)*100]). This means that we’re within an acceptable range and that no action is required.
Here are a few examples based on some other metrics. Let’s assume you're tracking the bounce rate on your website over time, and the performance trend looks like the chart below.
In this example, our long-term benchmark for bounce rate is 61%, and it’s mostly consistent over time. But in July, it dropped below our 20% threshold. This is a good thing, because lower bounce rates are generally better, so you need to remember which direction indicates improved performance, because up isn’t always better.
Then, in November, we saw the bounce rate spike, breaking through the acceptable range on the upper bound.
Across the year of data shown, there are only two periods where we need to roll our sleeves up and investigate. In July, we’d be looking to understand what we did that went well. In November, we’d be looking for issues or problems that may have contributed to poorer performance. In both cases, we’re looking for learnings. The difference is whether we’re looking for learning based on success versus failure.
Let’s look at one more example. The graphic below shows an engagement rate for Facebook posts over time. The established benchmark is 3.1%, and here, we can see a few more cases where we break through the upper and lower bounds. But remember, unlike bounce rate, in this case, up is good and down is bad.
With this example, we have slightly more volatile data, and there are several points where we would investigate further (i.e. four cases where we outperformed and four cases where we underperformed).
Tips for using the 20% rule
I like the 20% rule because it offers clear direction as to when you need to take action. Just because your website conversion rate dipped by 0.2% doesn’t mean you need to go into crisis mode to figure out why you’re below benchmark. At the same time, we should also avoid framing marginal gains in performance as a huge success.
With the above said, I want to share a few tips for how to apply the 20% rule effectively.
Use the 20% as a starting point
At the risk of sounding counter-intuitive, the 20% rule doesn’t have to be fixed to 20%. Think of the 20% threshold as a starting point for calibrating what a suitable threshold should be for your business and your marketing channels. The reality is that deviation from the mean will vary a lot from channel to channel. On your website, you might see a very narrow deviation from your benchmark, whereas on social channels like Facebook, you may see a very wide deviation. So use the 20% threshold as a starting point and calibrate it to your needs and each marketing channel. The latter point deserves repeating because you shouldn’t have a blanket benchmark threshold applied to all your various marketing channels.
Don’t set and forget your benchmarks
The threshold is only as effective as the underlying benchmark. And for your historical benchmarks, you need to ensure you’re keeping these up-to-date. You shouldn’t rely on a benchmark that includes data from years ago, so decide what interval you will use to maintain your benchmarks (e.g. past 30 days, past 6 months, past 20 posts, past 6 campaigns).
Key takeaways
To summarize, the 20% rule can guide you and your senior management in knowing when to act based on your campaign performance. It does this by setting a range that allows for some deviation from your benchmark, and when you fall within this range no action is needed. However, if your campaign performance goes beyond the upper or lower limits of the range, it's time to take action.
But remember, the 20% threshold is a useful starting but it may not be fit-for-purpose when it comes to all business types of a marketing channels. So make sure you calibrate it accordingly.
Thanks for reading!
