
Understanding P-Values: The Key to Grasping Statistical Significance
In the realm of statistics, p-values play a vital role in data analysis and decision-making processes. As one of the most widely used metrics, p-values provide a measure of the strength of evidence against a null hypothesis, helping researchers draw meaningful conclusions from their data.
But in the corporate world where hypothesis testing and quantitative research are commonplace, not everyone has a degree in statistics. And yet, the words “statistical significance” can get thrown around without much understanding as to what the term actually means.
So in this article, I want to walk you through what a p-value is, how it’s used in the world of hypothesis testing (e.g. A/B tests, etc), and how to interpret it.
But before we jump into p-values, let’s talk about hypothesis testing.
What is hypothesis testing?
Imagine you operate an online store where you sell your own line of clothing. And let’s say you average 5,000 site visits per week with a 1.35% conversion rate. That means that of the 5,000 weekly visits, roughly 68 (1.35%) of those visits convert to making a purchase.
But here’s the problem. You’ve had this nagging feeling that you’re leaving money on the table, and have some ideas for how to optimize your site experience, which you believe could unlock higher conversion rates.
Now let’s assume that one of your ideas was to change the way you show discounts to your visitors. In your current design, promotional discounts are displayed as a percentage reduction from the regular price. But you have a hunch that showing the discount in dollars (i.e. $5 off instead of 10% off) will be more enticing to visitors and thus improve conversion. This is a great hypothesis and one we can test through an experiment!

But first, there are a few things we need to understand in order to design our experiment. The first is the concept of an independent vs dependent variable. An independent variable represents the factor you manipulate or control in your experiment, and it’s presumed to have an impact on the dependent variable. On the other hand, the dependent variable is the outcome or result that is being measured or observed as a response to changes in the independent variable.
In my example, the way in which the discount is displayed to website visitors (i.e. % discount versus $ discount) is the independent variable, while the conversion rate is our dependent variable.
Now we also need to talk about how you would formulate your hypothesis for an experiment. When running an experiment, there are two types of hypotheses, which includes the null and the alternative hypothesis. The null hypothesis, usually denoted as H0, represents the default assumption or the status quo. It suggests that there is no significant difference or relationship between your independent and dependent variables.
On the other hand, the alternative hypothesis, usually denoted as Ha or H1, is the counterclaim to the null hypothesis. It asserts that there is a significant difference or relationship between variables. The alternative hypothesis offers an alternative explanation or hypothesis to challenge the null hypothesis. When the null hypothesis is true, it means that your intervention (i.e. independent variable) had no effect. On the other hand, if your experiment result suggests that the alternative hypothesis is true, this means that your intervention did have an effect.
And this brings us to the p-value.
What is a p-value?
The p-value is a common thread that runs through many types of statistical tests, from paired t-tests to ANOVA tests, to chi-squared tests. But when we’re doing an A/B test like the one I’ve described above, the type of test we’re running is usually a two-sample t-test or a z-test. If you’re wondering what all these letters mean, t-tests and z-tests are essentially just different statistical tools at your disposal for running a hypothesis test. And the p-value is the core output of many of these types of tests.
A p-value can be defined as the probability of obtaining test results equal to or more extreme than what you observed, assuming your null hypothesis is true. There are two key points to highlight from this definition. First, interpreting the p-values means that you assume your intervention had no effect (i.e. that the null hypothesis is true). In the world of hypothesis testing, you always assume your null hypothesis is true until you have enough evidence to believe otherwise. Second, the p-value measures the probability of something happening (i.e. obtaining another test result similar to what you observed), not what has already happened (i.e. your test result).
This is the part where I tend to see some people get confused, particularly those who are new to stats or testing. After all, the p-value is supposed to tell you about statistical significance. And yet, the definition above tells us p-values don’t really measure how accurate or truthful the result of our experiment’s intervention was. Instead, it tells you what the probability is that your intervention had no effect.
To really grasp what the p-value measures, you need to understand what it doesn’t measure. For one, the p-value is not a validation or confirmation that your test result is true, nor is it a direct measure of the significance of your alternative hypothesis. Quite the opposite actually, as it measures the probability that any observed difference in your test result was due to randomness. Alex Reinhart sums this up nicely in his book Statistics Done Wrong, when he says:
“[There] is a counterintuitive feature of significance testing: if you want to prove that your [intervention] works, you do so by showing the data is inconsistent with the [intervention] not working.”
I think Alex’s quote above perfectly captures what a p-value really measures.
Interpreting the p-value
Now when it comes to interpreting the p-value, this is where we encounter a vital threshold, commonly set at 0.05 (or 5%). Generally speaking, If your p-value is less than 0.05, the results are statistically significant, and you reject the null hypothesis. However, when it comes to interpreting the exact value, there are some shades of grey. The table below illustrates how strong or weak the evidence is against the null hypothesis based on where your p-vales is between 0.001 and 0.1. Any p-value greater than 0.1 tells you that your intervention (i.e. alternative hypothesis) was not significant and that your null hypothesis is true.
And although 0.5 or below is generally regarded as the threshold for significant results, that doesn’t always mean that a test result which falls between 0.05 and 0.1 isn’t worth looking at. It just means that the evidence against the null hypothesis is weak. But in your analysis, you could say, ‘Hey, the evidence is weak, but there is some support for the alternative hypothesis in our data, and this is interesting.’
The point is, although the 0.05 threshold is an important threshold when interpreting p-values, you shouldn’t get too hung up on applying it as a binary rule.

A working example
Let’s put this into an example. Say you actually made the change described earlier (i.e. showing discounts in $ instead of %), and after doing so, you had the following results:
7-day period before intervention | 5,378 visits | 73 conversions | 1.35% conversion rate
7-day period post intervention | 5,341 visits | 101 conversions | 1.89% conversion rate
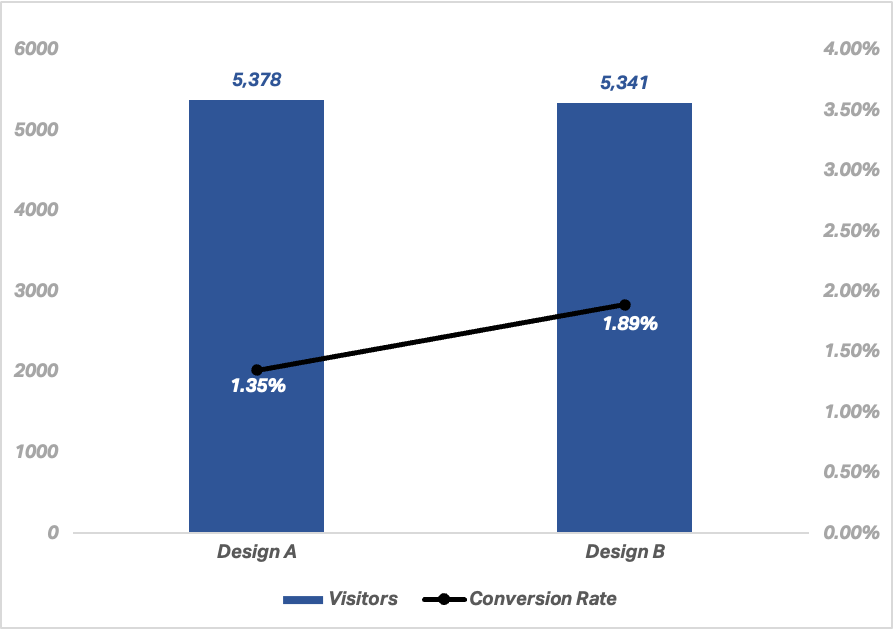
In this example, we observe a jump in conversion rate from 1.35% to 1.89%. And if we run this information through a statistical significance calculator, you would get a p-value of 0.0144 (using a 1-tailed test and assuming a 95% confidence level). This means we have a statistically significant result.
Another way to think about this result is that, if the null hypothesis is true (i.e. there's no real difference between design variant A and design variant B), you would expect to see data as extreme as, or more extreme than what you observed only 1.44% of the time due to random variation.
P-Value Misinterpretation: A Word of Caution
P-values can be easily misunderstood, and it’s important to remember that a p-value is NOT:
The probability that the null hypothesis is true. The p-value only tells you the probability of observing your data (or more extreme data), assuming the null hypothesis is true.
A definitive proof. A small p-value (less than 0.05) indicates moderate to strong evidence against the null hypothesis, but it doesn't 'prove' the alternative hypothesis.
In summary, the p-value helps us decide whether the results of an experiment are due to chance or whether they might indicate a true effect. It is the 'p' in p-value that keeps science honest, helping to guard against over-confidence or false-positive. However, like any tool, it needs to be used and interpreted carefully and with caution.
Thanks for reading!
