
The Benefits and Pitfalls of Using LLM’s for Qualitative Data Analysis (QDA)

Generative AI models, such as GPT, Claude, and Gemini, have established themselves as indispensable tools for market research professionals seeking to optimize their workflows and productivity. From research design to data cleaning and analysis, there’s no shortage of ways to leverage GenAI in market research.
This is a topic I’ve spoken on at great length, and if you’re interested, you can read this article for ideas on how to use ChatGPT for market research. One use case in particular that has received a lot of attention is the use of GenAI and LLM’s to conduct thematic analysis of unstructured text data, otherwise known as qualitative data analysis or QDA for short.
Despite what you may think, the application of QDA isn’t limited to qualitative methodologies like interviews and focus groups. Surveys can actually produce a great deal of unstructured text data from open-end questions, and analyzing this data at scale can be a challenge.
The good news is, LLM’s have shown enormous potential to streamline the process of carrying out QDA for small and large datasets alike, and for a fraction of the cost.
But as exciting as the applications of LLMs to market research are, they are not without their challenges, and risks.
One of the things that scares me the most about using GenAI, especially for data analysis, is just how convincing bad output can be. Indeed, LLM’s can be very effective at creating an illusion of truth.
A good example of this can be found in an experiment my former colleague, Dr. Antarika Sen, and I conducted last year and presented at UXCon 2024. We designed an experiment where we tasked LLMs to analyze a large open-ended text dataset from a survey, and we compared the results to a human panel of analysts. The results were fascinating, pointing to both benefits and risks of using LLM’s for QDA.
But before I dive deeper into the results of our experiment, let me provide some context around the use case.
Text analysis in research
Most people associate quantitative research (i.e. surveys) with closed-ended data structures, such as a multiple-choice question. However, it’s common to obtain a significant amount of unstructured data in surveys through open-ended (OE) questions. This question type allows respondents to type their responses in a free-form format. Although most questions in a survey will be closed-ended (CE), it’s usually beneficial, if not necessary, to include some OE questions.
The challenge with OE data, however, is that it can be difficult to analyze. The most common method involves a method we call coding. In research, coding is a form of qualitative data analysis (QDA) that involves systematically categorizing and labelling text data into recurring concepts. For example, imagine you ran a survey about views toward smartphone features and used an OE question to allow respondents to describe, in their own words, the smartphone features that are most important to them. Once you’ve collected this data, you can use coding to categorize the responses into themes, such as camera quality, battery life, screen size, etc. Researchers will then analyze and report on statistics, like code frequency. You can think of coding as a way of converting unstructured text data into a structured format that can be more easily analyzed.
Example of OE coding using LiGRE Software
There are two types of OE coding:
1) Inductive coding
Inductive coding is used when you don’t have a predefined set of codes (i.e. themes), so you discover them during data analysis. For example, let’s say you run a concept test survey and ask respondents what they liked or didn’t like about your idea using an OE question. In this example, you may not know in advance what respondents will say, so you use inductive coding to discover new themes ion your data.
2) Deductive coding
On the other hand, deductive coding is where you approach your dataset with a predefined set of codes, and you look for them when analyzing your data (this is usually called a code frame). As you might imagine, deductive coding is often much faster, because you already know what you’re looking for.
Both inductive and deductive coding have benefits and trade-offs. The advantage of inductive coding is that it ensures you approach your data with an open mind and identify codes/themes that truly reflect the data. However, the process of discovering codes can be challenging, iterative, and highly subjective.
Regardless of whether you use inductive or deductive coding, historically the process would be carried out in one of three ways: 1) manually by yourself, 2) by paying a data processing vendor or using commercial software like NVivo, or 3) by using code libraries like Python’s NLTK. The problem is, option one is time-consuming, option two is expensive, and option three can be very technical and beyond the skill set of an average researcher.
Open-end data and LLMs
This is where GenAI comes in handy. You can feed an LLM a large text dataset, and with minimal instructions and time, and it can generate a fully coded and categorized document.
The first time I processed OE data with ChatGPT, my jaw hit the floor. The LLM had turned days of work into seconds and for a fraction of the price ($20 for my ChatGPT subscription). I was impressed. Even the best QDA software I had tried, with their stacked feature sets and hefty annual subscription fees, were nowhere near as usable or fast as ChatGPT. For context, NVivo, one of the leading QDA providers, charges between $1,000 to $2,000 for a subscription. And the learning curve for using traditional QDA software can be steep.
But as I tried to leverage LLMs for real-world uses (e.g. paid client work), some cracks began to appear. And this is what led my colleague, Antarika, and I to explore this use case further.
The OE coding experiment
Our goal was to test the quality of output from an LLM when given an OE coding task. We did this by using text data from a survey that had already been coded (inductively) by a professional data processing vendor. This meant we had a human benchmark to compare the results to.
We used a single OE question from a survey which asked respondents how they define success in life. This question was chosen because it resulted in slightly more verbose and varied responses than a typical survey OE question would; hence it posed a more challenging task for the LLM.
In total, we had over n=1,500 unique responses to this OE question. The data was in CSV format, with two columns: one for a unique respondent ID and another for the OE response.
We tested and iterated several prompts, starting with a zero-shot prompt that was short and concise:
Please perform thematic analysis of the open-ended responses provided in the attached file. Give me a list of themes and a percentage score against each.
The output with this prompt was far from ideal, as the LLM needed to make a lot of assumptions about what we wanted the output to look like. So we iterated a few times and eventually landed on the following prompt:
You are an expert survey research analyst. You excel in analyzing qualitative, open-ended data.
I ran a survey with N = 1500 respondents. One of the questions asked in the survey was an open-ended question: “How would you define success in life?”.
I will upload a document that consists of all the responses. In the file, each row represents a unique respondent (identified by unique participant_ID).
Please do a thematic analysis of the answers and categorize them into relevant topics (up to 20 topics). For each topic, provide the number of samples and a percentage count. While coming up with the codes and themes, please review ALL the responses.
Please organize the output into a table format. The first column is the name of the theme, the second column being descriptions of the themes, the third column is frequency, the fourth being the percentage of respondents, and the fifth column includes some verbatim quotes that belong to this theme.
We then ran the same prompt and dataset through multiple AI models, including GPT-4o, Claude 3 Opus, Claude 3 Haiku, and Gemini 1.0 Advanced.
What did we learn?
The table below shows the redacted codes created by each model (and the human panel), as well as the frequency by count and percentage. The percentage shows the number of times the code was assigned to an OE, divided by the total sample size.
The codes have been redacted for privacy, except for “Other” codes. Each redacted code (i.e. claude 3 Opus: Code 1, GTP4o: Code 2, etc) is a unique theme identified by the LLM based on it’s analysis of the dataset.
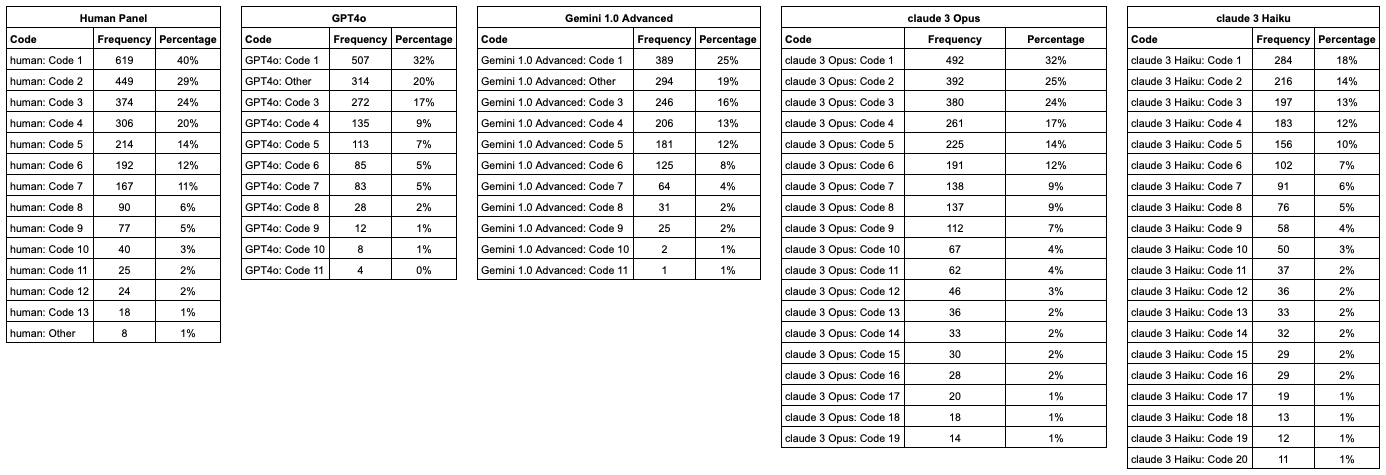
From the table, we can see how each model performed in terms of a) how many codes were created, and b) the general size of the codes (according to the frequency). For example, both Claude Opus and Haiku produced the most codes at 19 and 20 respectively, and GPT and Gemini created the fewest, at 11.
It’s worth noting that each code was not exclusive, meaning a text response can belong to more than 1 code. Furthermore, since the codes are redacted the table doesn’t show the relationship between codes across models. However, we will show cover code relationships later in this analysis.
Average code size
The average code size in terms of count (i.e. total number of OE responses associated with a code) was 124 for GenAI versus 186 for humans. This means that the human panel, on average, identified themes that captured more of the dataset. It was interesting to see that the “Others” code for the human panel was only 1%. But for GPT and Gemini, it was the second largest, at around 20%.
Why the ‘Others’ code was so big for GPT and Gemini remains unclear. It may be the result of the model sampling a subset of the data, or simply the model trying to optimize for output efficiency. Either way, 20% is a lot of data to leave uncategorized, and in a real world setting a professional researcher would usually try to contain an ‘others’ or ‘miscellaneous’ code to 10% or less.
On the other hand, both Claude Opus and Haiku did not create an ‘Other’ code at all, as they insisted on trying to categorize everything. This resulted in a long list of codes (19-20), many of which were low frequency (less than 5%). This wasn’t particularly ideal, as it resulted in a lot of low frequency codes that aren’t particularly representative of a core theme in the data.
Consistency of codes identified across models
We analyzed the codes created by each model, as well as the consistency in these codes across the various models. To recap, an inductive QDA approach was used where we asked the LLM to identify codes from scratch.
The relationships between codes identified by different models can be understood in terms of explicit and implicit consistency. Explicit consistency occurs when the codes identified share the same root word. For example, if one model identifies a code labelled “happiness” and another identifies a code labelled “happy“, then we can consider these to be explicitly consistent.
Implicit consistency, on the other hand, refers to cases where the codes are worded differently but convey similar meaning. For example, if one model identifies a code labelled “happiness” and another model identifies a code labelled “joy”, these would be implicitly consistent.
The graphic below show the top 5 codes that were explicitly consistent across all models as well as the human panel.
The five colourized bars in green, blue, red, yellow and orange represent explicitly consistent codes across the models. This graphic also shows the size of the code, shown by the width of the bar as well as the percentage within the bar.
For example, code 1 identified by the human panel was explicitly consistent with code 1 identified by GPT-4o, Claude 3 Opus and Haiku as well as code 3 identified by Gemini 1.0 Advanced (see green bars).
It was encouraging to see a level of explicit consistency across the top codes identified by each model using an inductive approach. However, the variance of the average code size is a concern. For example, code 1 identified by the human panel represented 40% of the dataset. But the same theme identified by Gemini (i.e. Code 3) was only 16% and only 18% for Claude 3 Haiku (Code 1). This is a significant difference, and one that would absolutely impact or change the way a researcher might interpret the dataset.
Next, we mapped out all of the relationships between the various codes, whether implicit or explicit. The interactive graphic below visualizes these relationships.
What’s interesting about the graphic above is we can also see the relationship in the rank order of the codes. For example, if you click on Code 1 for Human, this was also the first ranked code for all models except Gemini.
Some key learnings
Based on the experiment findings, we identified 5 key lessons when it comes to using LLMs to carry out QDA and code text-based data.
Lesson 1 - The first prompt matters (a lot)
We experimented with a few different approaches to prompting, from zero-shot to few-shot prompts, to prompt chaining, etc. In the end, we found we got the best results with a single, comprehensive prompt that included the following:
Role definition - Tell the LLM what their role is (e.g., ”you are a research analyst”)
Task background - Provide a summary of the task, including what you want it to do, why, and what your objective is.
Describe input file - In this scenario, we submitted a data file that the LLM must interrogate to complete the task. And so, you should describe the structure/schema of the data file.
Task instruction - Describe the key requirements of the task, and break it down into steps and/or key requirements.
Define output format - Describe how you want the output to be delivered/structured.
Lesson 2 - Be cautious with inductive coding
As we saw earlier, there was some consistency in the codes across the models. However, there was also a lot of variance in the number of codes, the code labels, and size. If you intend to use an LLM for inductive coding, take a systematic and iterative approach, rather than relying on what you get from the first model and prompt you use.
We would suggest running your data through multiple models, and use this output to derive a set of final codes. Then you can carry out deductive coding with your model of choice, which codes according to your predefined code frame.
Beyond the code label, it would also be beneficial to include a short definition of the code, and some examples.
Lesson 3 - Check the model’s work
We experienced a lack of transparency in how the LLMs carried out the coding task. This limited our ability to audit how the LLM scanned and categorized the data.
In fact, we had a strong suspicion that some of the models were cutting corners, and sampling the data rather than reading the full dataset. To recap, there were 1,500 rows of text data to be coded, but at least one of the models appeared to be only drawing from the first 20 rows of data. To address this, we ran a follow-up prompt to ask for proof of work. The follow-up prompt looked like this:
For each of the themes you identified, give me 5 random verbatim examples of specific text that was used.
Although it wasn’t perfect, this follow-up prompt helped us audit the LLM’s work and confirm whether the model was scanning the full dataset or sampling.
It’s worth noting, however, that with the rise of chain-of-thought in models like DeepSeek R1, you can get a lot more transparency out of proprietary models today. And it would be worthwhile re-running this experiment with a model like DeepSeek (something I intend to do).
Lesson 4 - Humans aren’t objectively ‘better’ at QDA
There were at least two themes that all of the LLM’s identified, but which the human panel didn’t. These codes were also big enough to matter, and we actually found that discovering these codes via the LLMs was quite insightful. In many ways, the models performed worse than the humans; such as the Other theme being too big for GPT and Gemini, and Claude identifying too many small themes. With that said, the LLM’s did add value to the process by identifying new, valuable themes for our analysis.
Lesson 5 - Familiarity with your data is key
If you’re going to use GenAI for QDA, it’s important that the person working with the LLM is familiar with and understands the data. I say this because, in the world of market research, it’s not uncommon for someone who isn’t inherently familiar with the data to analyze it. For example, you might use a data processing vendor to code your text data, and that process is carried out by someone who wasn’t involved in crafting the questionnaire design or analyzing the full dataset (not just the OE’s).
But if you’re using a proprietary LLM, it’s key that the individual using it understand the data, which includes being familiar with the questionnaire and survey script, as well as responses to other questions, etc. This way, you will be better equipped to audit the results from the LLM and assess how well it carried out the task.
As mentioned earlier, LLMs are very good at creating an illusion of truth. You write a prompt, import your data, and boom; your data’s processed in seconds. But it’s not until you start peeling back a few layers that you realize the output might be misleading, or even complete garbage.
Limitations
There are a few limitations of this experiment that I’d like to call out.
Model updates and advancements - This data was processed and analyzed in March 2024, and since then there have been a lot of developments in the world of GenAI, from newer versions of the models used (like GPT-4.5 and Gemini 2.0) as well as the emergence of impressive new models, like DeepSeek R1. The latest models available today could very well outperform these results.
Human panel - Although the human-coded results used in the experiment were based on a professional data processing company’s work, the experiment was still only based on a single human coder. QDA is both an art and science, but it’s also very subjective. So in the future, it would be ideal to have multiple human coders to compare with.
Text dataset variability - We chose a dataset based on an open-ended survey question that garnered slightly more verbose responses (i.e. an average of 113 characters). It’s common in survey-based research to get very brief responses to OE questions (e.g. one word or 10 characters or less). But at the same time, some research methods can include text datasets that are much longer, such as an interview transcript. I think it goes without saying that the average length of the text data would impact the quality of results, and so it would be interesting to see future experiments that test text data of different lengths.
Conclusion
In summary, while generative AI offers remarkable potential for streamlining qualitative data analysis, particularly in coding open-ended survey responses, it's crucial to approach its use with a critical and informed perspective. Our experiment highlights the importance of meticulous prompt engineering, iterative testing across multiple models, and rigorous verification of outputs. Although LLMs can reveal valuable insights that may be overlooked by human analysts, they are not a replacement for human judgment and expertise. Ultimately, a hybrid approach, combining the efficiency of AI with the nuanced understanding of human researchers, will yield the most reliable and actionable results.
